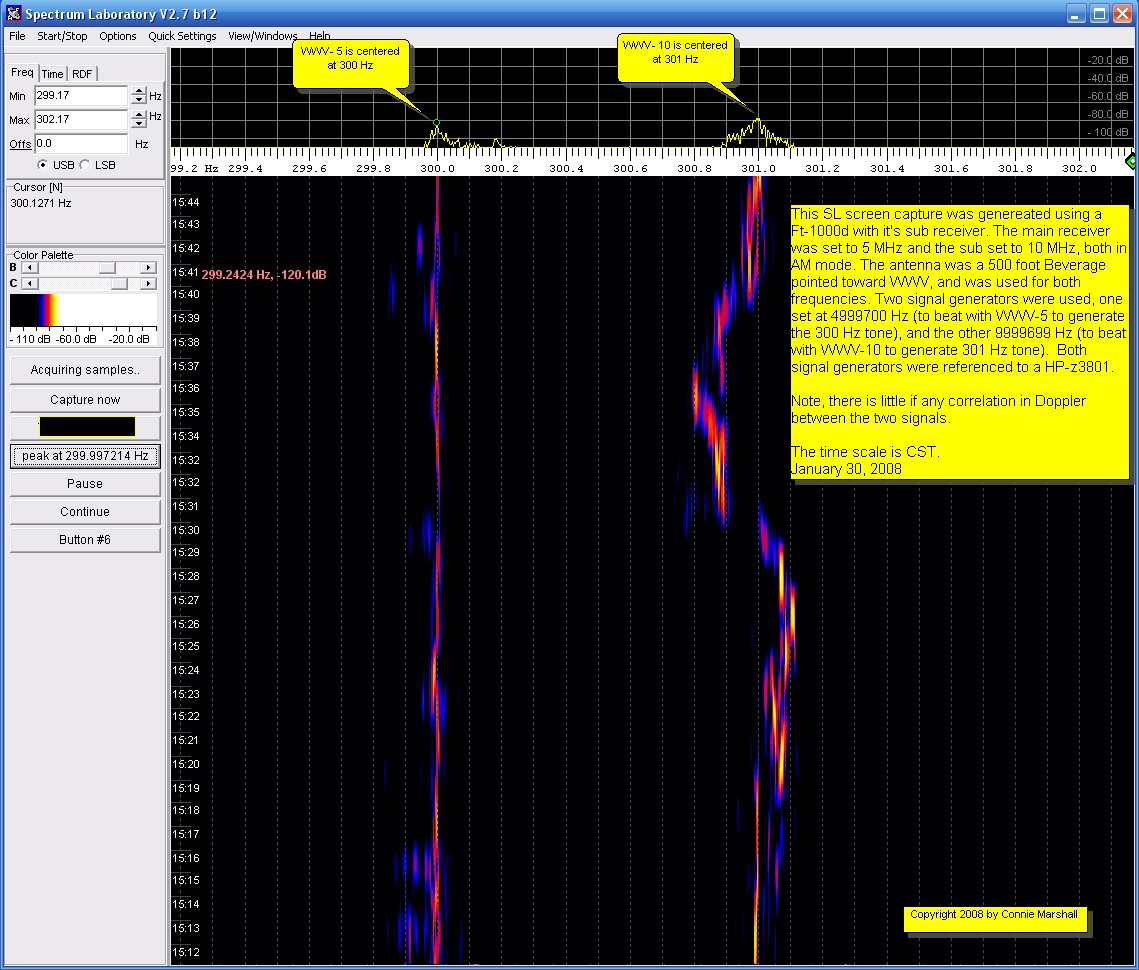
On the the first page of this website I mention the possibility of using WWV as an indicator of what the state of the ionosphere might be and then use that information to bias readings in an FMT on a different frequency.
The screen captures below shows two separate signals. Both are WWV, but on two completely different frequencies. This allows the close inspections of the two signals standing side by side in real time.
This shot shows WWV 2.5 and 5 MHz over a relative long time span of 5 hours. Again, very little Doppler correlation can be seen.
In both of the above test, the lower frequency is probably being propagated via the E-layer, although some F-layer can be seen simultaneously with the E-layer in both screen shots, but more pronounced in the second screen shot. More testing needs to be done when both signals are being propagated by the F-layer.
copyright 2008 by Connie Marshall